


Markets look simple—until they don’t. Price moves up, then down, then stalls. Many traders assume direction equals strength. That mistake leads to late entries and poor exits.
Understanding trend direction is not enough. You need to measure strength behind that move. This is where DMI forex analysis becomes critical.
Recognizing overall market trends and the underlying price trend is crucial for making informed trading decisions.
What Is the Directional Movement Index (DMI)?
The directional movement index forex indicator is a technical analysis tool that measures both direction and strength of a trend. The Directional Movement Index (DMI) was developed by J. Welles Wilder in 1978 to determine the overall direction of an asset’s price.
It consists of three components:
- Positive Directional Indicator (+DI): This is the positive directional movement line, one of the two lines that form the core of the indicator.
- Negative Directional Indicator (-DI): This is the negative directional movement line, the second of the two lines that make up the main components of the DMI.
- Average Directional Index (ADX): The average directional movement index is a third line that gauges the strength of upward or downward trends.
The DMI consists of two primary components, the positive directional movement line (+DI) and the negative directional movement line (-DI), and the average directional movement index (ADX) is a third line used to gauge the strength of upward or downward trends. The DMI identifies market trends and measures their strength in Forex, and is also commonly used in crypto, commodities, and stock indices.
Together, these three components help traders evaluate bullish bearish strength forex conditions with precision.
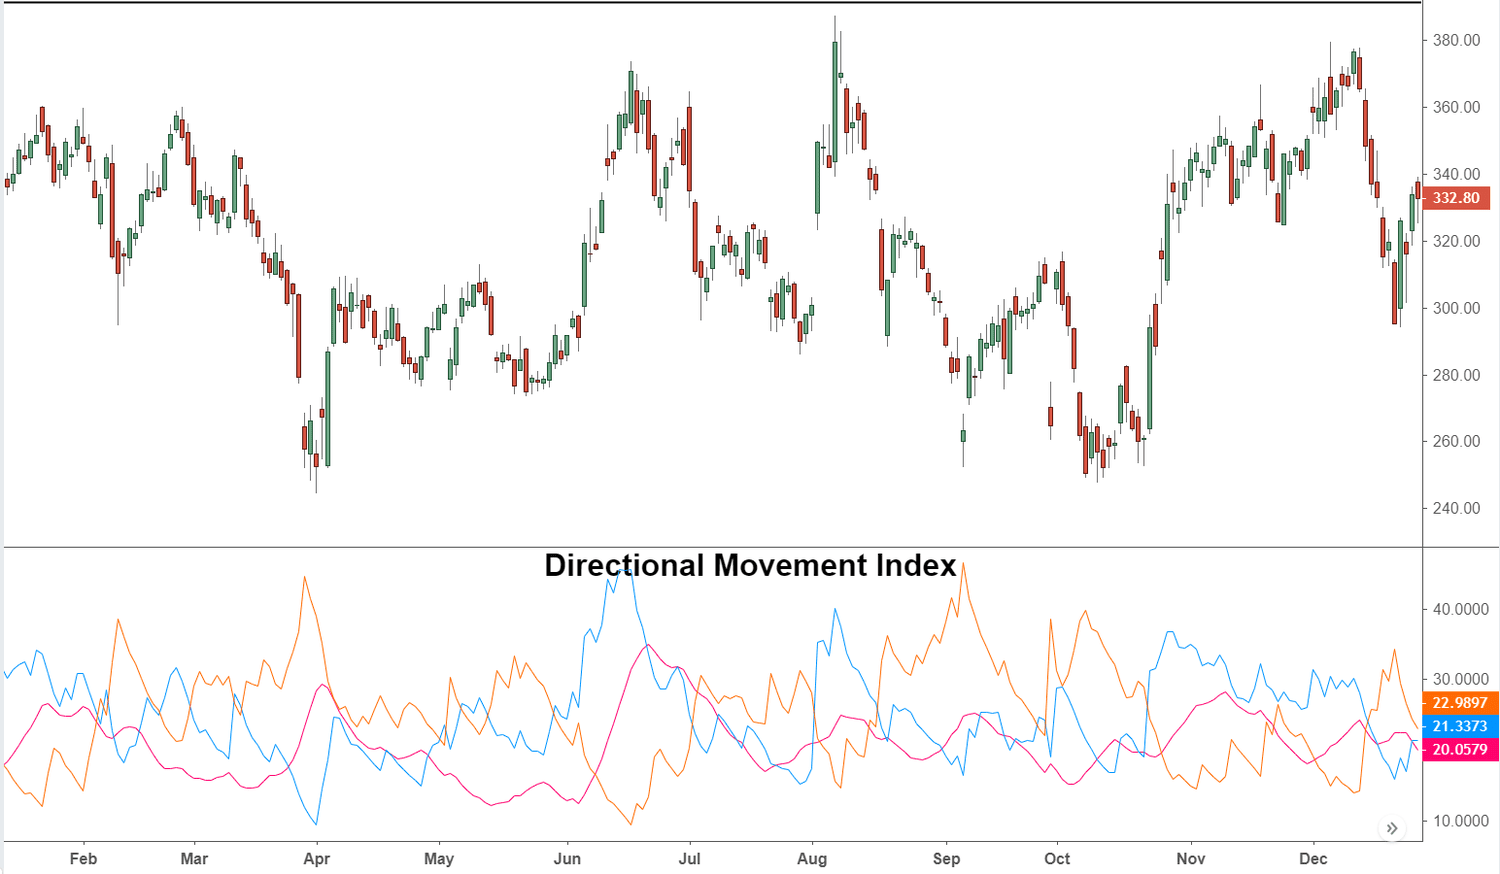

How DMI Works in Forex Trading
The directional movement index dmi focuses on identifying directional movement in the market.
- +DI tracks upward price movement
- -DI tracks downward price movement
- ADX measures trend strength, regardless of direction
+DI measures the strength of upward price movement, while -DI tracks the strength of downward price movement.
The DMI helps traders assess trend direction by comparing prior highs and lows, and it is primarily used to provide trade signals. Typically, a 14-period setting is used for the DMI indicator across various currency pairs.
The DMI is calculated by determining the Positive Directional Movement and Negative Directional Movement, then dividing by the Average True Range (ATR), which is derived from the true range of price movements. The ATR provides a measure of market volatility that helps refine the sensitivity of the indicator calculations.
DMI and ADX are considered trend following indicators, helping traders identify trending versus non-trending markets.
When combined, these elements provide a structured view of price movement and underlying momentum.
Understanding the Three Components
1. Positive Directional Indicator (+DI)
The positive directional movement line (+DI) reflects buying pressure.
- When +DI rises → stronger bullish markets
- When +DI crosses above -DI → potential buy signal
+DI measures the strength of upward price movement.
When +DI is above -DI, the price has more upward pressure than downward pressure, indicating a bullish trend. This indicates increasing upward pressure in the market.
2. Negative Directional Indicator (-DI)
The negative directional movement line (-DI) reflects selling pressure.
- When -DI rises → stronger bearish markets
- When -DI crosses above +DI → potential sell signal
-DI tracks the strength of downward price movement. When -DI is above +DI, the price has more downward pressure, indicating that sellers are dominating and a bearish trend is suggested.
This suggests growing downward pressure.
3. Average Directional Index (ADX)
The average directional movement index (ADX) is the third line in the DMI system and measures trend strength.
- Rising ADX → strong trend
- Falling ADX → weak or sideways market
A rising ADX indicates gaining trend momentum, while a falling ADX suggests a weakening trend.
It does not indicate direction. It only confirms strength.
Calculating DMI
Calculating the Directional Movement Index (DMI) involves a series of steps that help traders quantify both the direction and strength of a trend. The process begins by comparing the current high to the previous high, and the current low to the previous low. These differences, known as directional movement, reveal whether buyers or sellers are dominating the market.
- Step 1: Calculate the difference between the current high and the previous high (HiDiff), and the difference between the previous low and the current low (LowDiff).
- Step 2: Determine which value is greater. If HiDiff is larger and positive, it represents positive directional movement. If LowDiff is larger and positive, it represents negative directional movement.
- Step 3: Apply a smoothing technique, often called the Welles Summation, to these values over a set period. This results in the +DI (positive directional indicator) and -DI (negative directional indicator) lines, each ranging from 0 to 100.
- Step 4: Calculate the Average Directional Index (ADX) using the smoothed values of +DI and -DI. The ADX measures the overall strength of the trend, regardless of whether it is up or down.
By following these steps, traders can use the directional movement index DMI to objectively assess trend direction and strength. The combination of +DI, -DI, and the average directional index ADX provides a comprehensive view of market momentum, helping traders make more informed decisions based on current high, current low, previous high, and previous low price data.
How to Read Bullish and Bearish Strength
Bullish Trend Conditions
A strong bullish setup forms when:
- +DI is above -DI
- ADX is rising
- Price shows higher highs
This confirms a bullish trend supported by strong momentum.
Bearish Trend Conditions
A bearish setup develops when:
- -DI is above +DI
- ADX is rising
- Price forms lower lows
A sell signal occurs when the -DI line crosses above the +DI line, indicating a downward trend. Conversely, a downward trend is signified by this crossover.
This signals a strong bear market with increasing selling pressure.
DMI vs Other Indicators
| Feature | DMI Forex | Moving Averages | Stochastic Oscillator |
| Measures direction | Yes | Yes | No |
| Measures strength | Yes (ADX) | Limited | No |
| Works in trending markets | Strong | Moderate | Weak |
| False signals in sideways market | Lower | High | High |
| Components | Three | One | One |
Compared to other technical indicators, the directional movement index forex provides a more complete framework.
Identifying Trend Strength with ADX
The average directional index adx plays a key role.
- ADX below 20 → weak trend
- ADX above 25 → strong trend
- ADX above 40 → very strong trend
This helps traders avoid trading in a weak or sideways market.
Identifying Divergences
Spotting divergences between the Directional Movement Index (DMI) and price movement is a powerful way for traders to confirm or question the current trend direction. Divergences occur when the signals from the DMI do not align with what is happening on the price chart, often hinting at a potential reversal or a weakening trend.
- Bullish divergence happens when the +DI line crosses above the -DI line, even as price action may not yet reflect a clear uptrend. This can signal that upward momentum is building before it becomes obvious in the price movement.
- Bearish divergence occurs when the -DI line overtakes the +DI line, suggesting that downward pressure is increasing, even if the price has not yet started to fall significantly.
Traders often enhance their analysis by comparing DMI signals with other technical indicators, such as moving averages or the Relative Strength Index (RSI). For example, if the DMI shows a bullish divergence while a moving average crossover also points to an uptrend, the combined evidence strengthens the trade signal.
Additionally, analyzing chart patterns—like head and shoulders, triangles, or double tops—alongside DMI readings can help confirm potential trend reversals or continuations. By integrating these analytical tools, traders can filter out false signals and improve the accuracy of their trading strategies, making the most of the directional movement index dmi in various market conditions.
Common Trading Strategies Using DMI
1. Trend Following Strategy
Use DMI as a trend following indicator.
- Enter long positions when +DI crosses above -DI
- Enter short positions when -DI crosses above +DI
A short trade can be initiated when the -DI line crosses above the +DI line and the ADX confirms a strong trend.
Confirm with rising ADX for better accuracy.
2. Breakout Confirmation
DMI helps validate breakouts.
- Rising ADX confirms strong trend
- Low ADX suggests potential false signals
This reduces risk during volatile market conditions.
3. Combine with Other Indicators
For stronger signals, combine DMI with:
- Moving averages
- Bollinger Bands
- Stochastic oscillator
DMI should not be used in isolation due to the potential for false signals, and is often paired with other indicators like RSI, which can help identify overbought territory and filter out overextended moves. Combining the DMI with other indicators can help filter out weaker setups and provide a more comprehensive market view.
This creates a more robust technical analysis framework.
Avoiding False Signals
False signals occur frequently in sideways markets.
To reduce false signals:
- Avoid trading when ADX is low
- Wait for clear directional movement
- Confirm with price action and structure
DMI is designed to reduce false signals, but confirmation is still necessary.
Practical Example
Consider a scenario during an ECB policy announcement.
Price spikes upward. +DI crosses above -DI. ADX starts rising.
This confirms strong upward price movement backed by institutional flow.
Later, ADX drops. The trend weakens. Traders exit before reversal.
Advantages of DMI Forex
- Measures both direction and strength
- Helps identify bull markets and bearish markets
- Filters weak trends effectively
- Works well in fast moving markets
- Supports better trading strategies
Limitations of DMI
- Lagging nature due to smoothing
- Less effective in sideways market conditions
- Requires combination with other indicators
Like all analysis tools, it performs best when integrated into a broader system.
Risk Management
Effective risk management is crucial when incorporating the Directional Movement Index (DMI) into your trading strategy. Since the DMI can generate signals in both bull and bear markets, traders must take steps to protect their capital, especially during periods of weak or sideways market conditions where false signals are more likely.
- Set stop-loss orders: Use the distance between the +DI and -DI lines, as well as the current ADX value, to determine appropriate stop-loss levels. A wider gap and a rising ADX suggest a stronger trend, allowing for slightly wider stops, while a narrow gap or falling ADX calls for tighter risk controls.
- Adjust position size: Base your trade size on the strength of the trend indicated by the ADX. In a strong trend (rising ADX), you may choose to take larger positions, while in a weak or sideways market (falling ADX), smaller positions or no trade at all may be safer.
- Avoid low ADX periods: When the ADX value is low, the market is likely consolidating, and false signals are more common. It’s often best to stay on the sidelines until a clear trend emerges.
- Combine with other indicators: Confirm DMI signals with additional technical indicators such as Bollinger Bands, the Stochastic Oscillator, or moving averages. This multi-indicator approach helps filter out noise and reduces the risk of acting on false signals.
By integrating the directional movement index dmi with sound risk management practices and other technical indicators, traders can navigate changing market conditions more effectively. This approach not only helps protect against losses in sideways markets but also positions traders to capitalize on strong trends in both bull and bear markets.
Actionable Takeaways for Traders
- Focus on trend strength, not just direction
- Use ADX to confirm valid trends
- Avoid trading during low ADX conditions
- Combine DMI with other technical indicators
- Monitor market conditions before entering trades
When Should You Use DMI?
Use DMI when:
- Markets are trending strongly
- You need clarity on bullish bearish strength forex
- You want to avoid weak setups
It is especially effective during high liquidity sessions influenced by central bank activity.
Final Thoughts
Markets reward clarity. Not guesswork.
The directional movement index forex provides that clarity by breaking down directional movement into measurable components. It shows whether buyers or sellers are in control—and how strong that control really is.
If you rely only on price direction, you will often miss the bigger picture. But when you combine direction with strength, your decision-making improves significantly.
In modern financial markets, where volatility shifts quickly, tools like DMI forex are no longer optional. They are essential for consistent performance.
FAQs
- What is DMI in forex trading?
The Directional Movement Index (DMI) is a technical indicator that measures both trend direction and strength using three components: +DI, -DI, and ADX. - What do +DI and -DI represent?
+DI indicates bullish (buying) pressure, while -DI shows bearish (selling) pressure. Crossovers between these lines generate potential buy and sell signals. - What is the role of ADX in DMI?
ADX measures the strength of a trend regardless of direction. A rising ADX indicates a strong trend, while a falling ADX suggests weak or sideways market conditions. - How do you identify a strong trend using DMI?
A strong trend is confirmed when:
- +DI is above -DI (bullish) or vice versa (bearish)
- ADX is rising above 25
This combination signals strong momentum in the market.
- Is DMI suitable for all market conditions?
DMI works best in trending markets. It is less effective in sideways or low-volatility conditions where false signals may occur. - How can you use DMI in a trading strategy?
You can:
- Use DI crossovers for entry signals
- Confirm trends with ADX
- Combine with indicators like moving averages or RSI for better accuracy
7. What are the limitations of DMI?
DMI is a lagging indicator due to smoothing, may produce false signals in ranging markets, and should not be used as a standalone tool.